I know this may be a bit dark but this event shows how poor planning and loose (to no) safety measures can cause such a huge catastrophe.
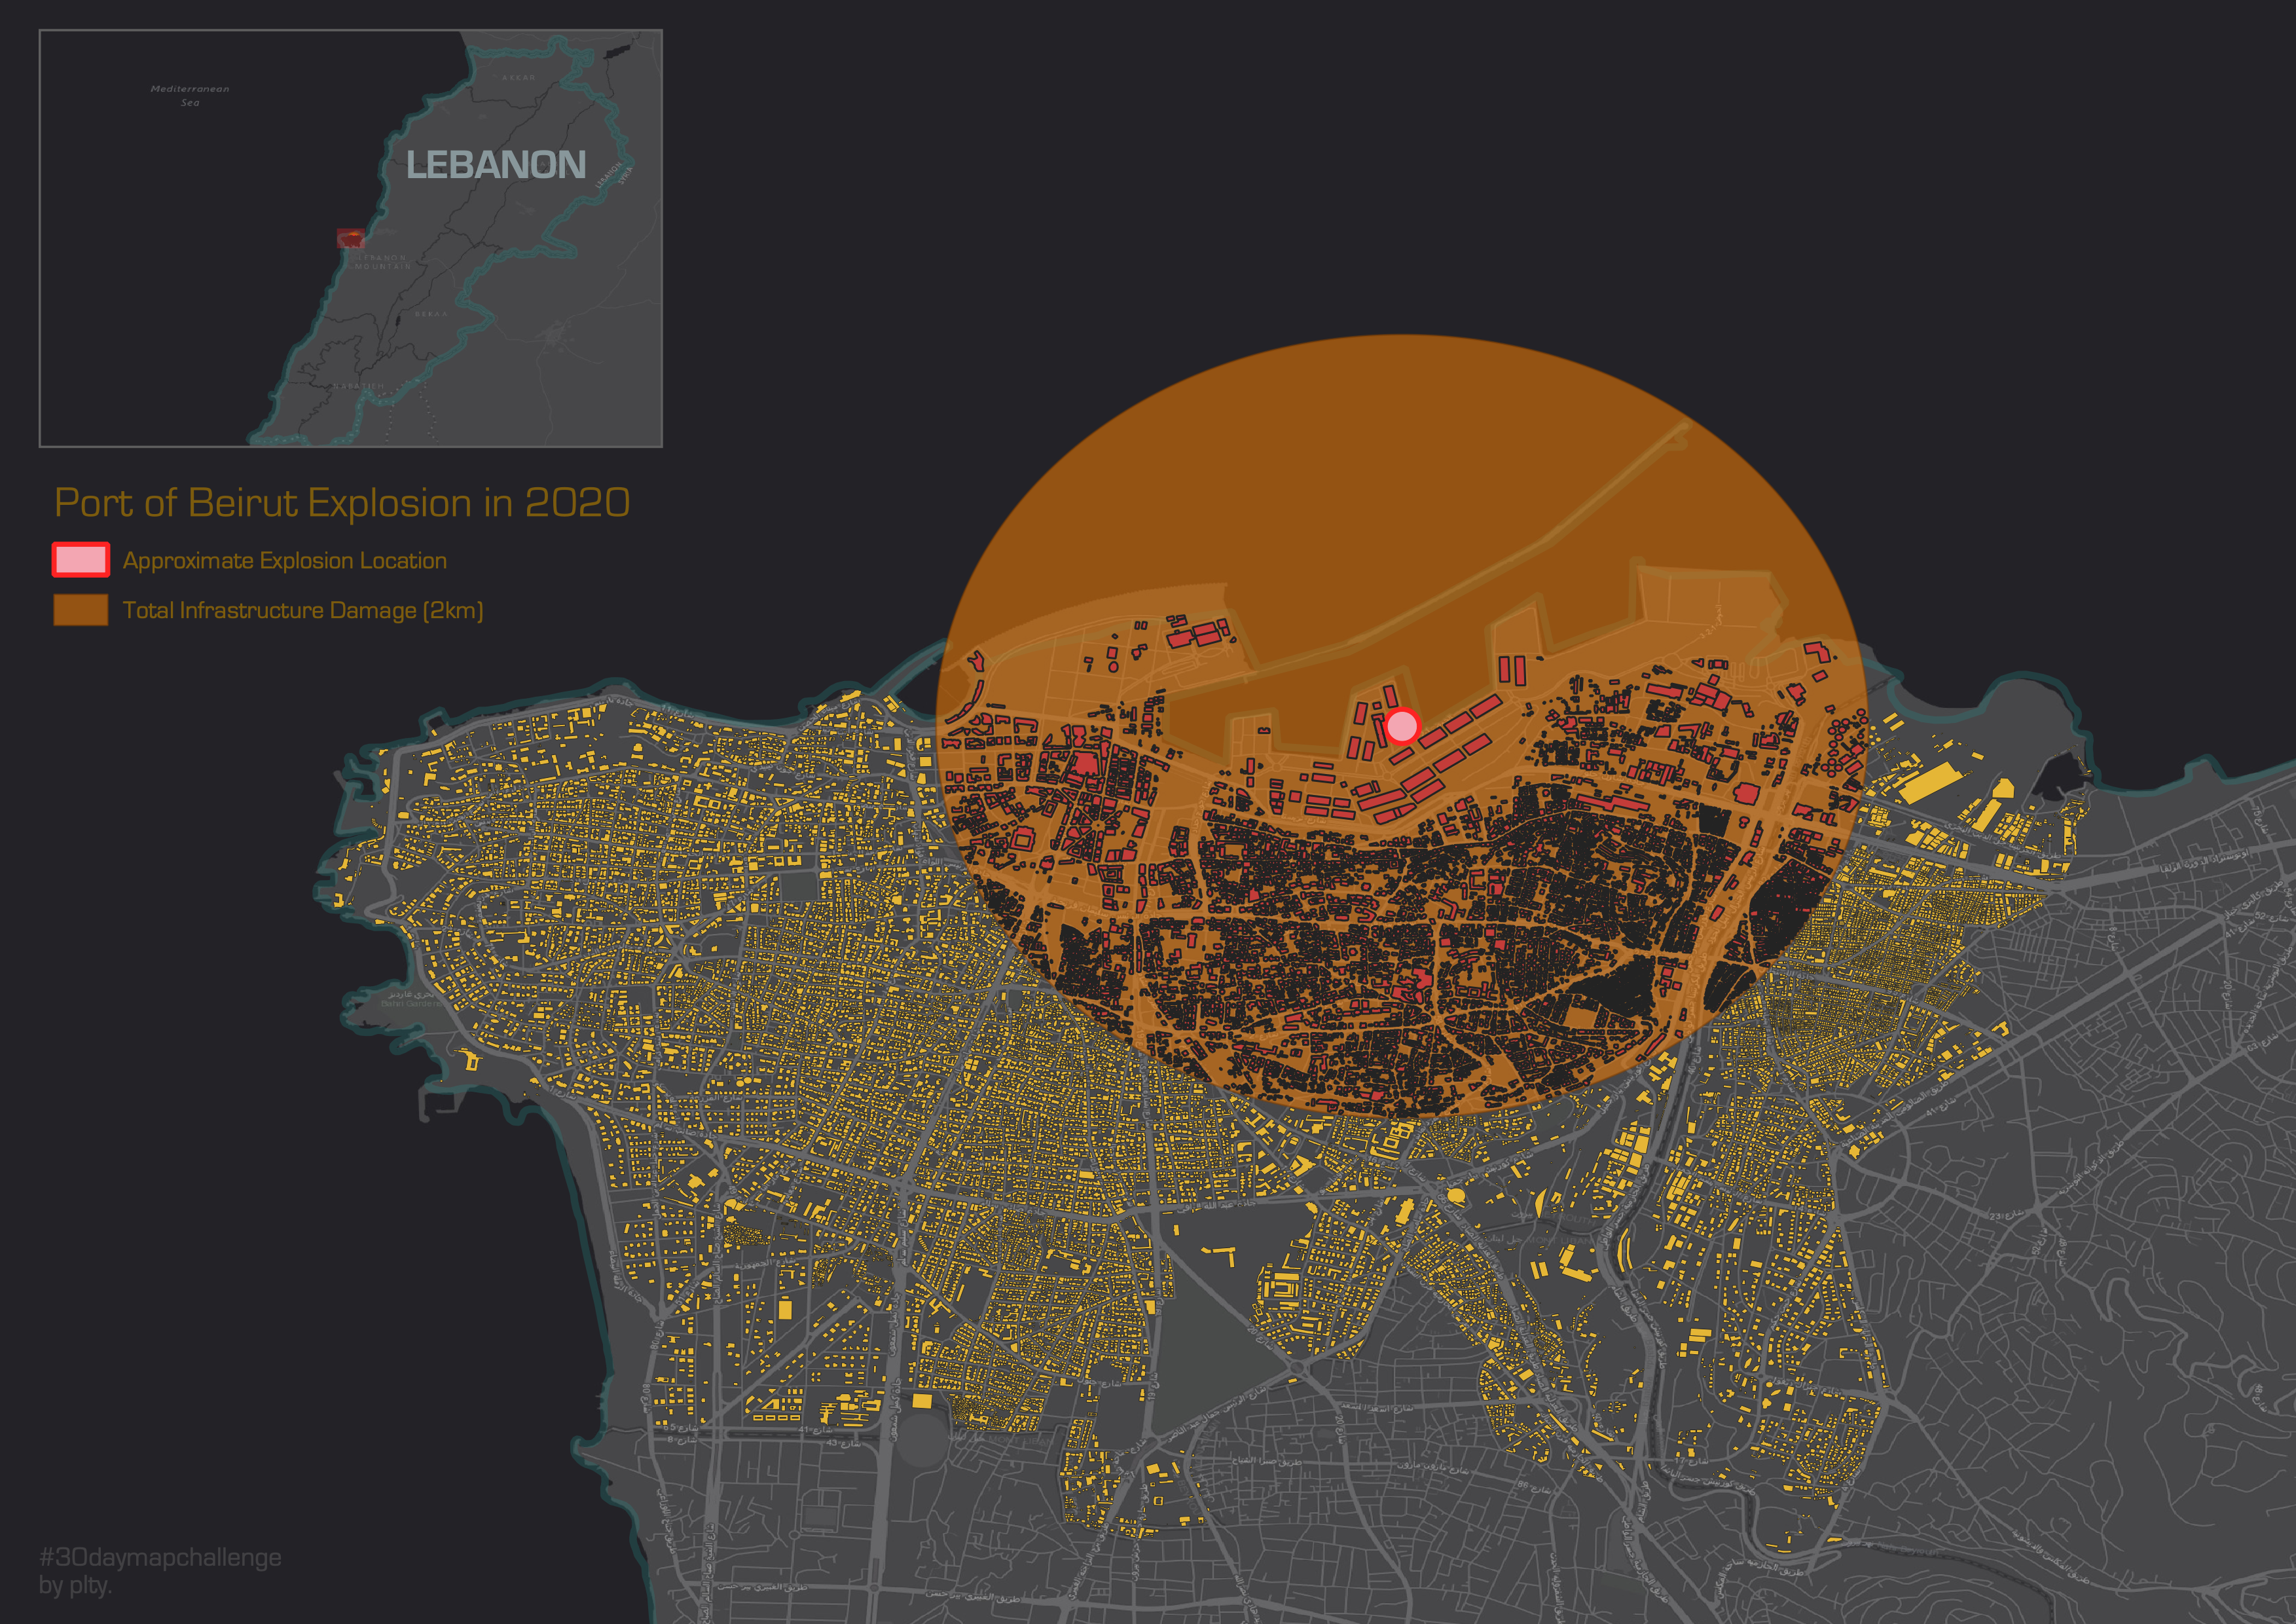
On 4 August 2020, a large amount of ammonium nitrate stored at the port of the city of Beirut, the capital of Lebanon, exploded, causing at least 203 deaths, 6,500 injuries, and US$15 billion in property damages, and leaving an estimated 300,000 people homeless.[1][2] A cargo of 2,750 tonnes of the substance (equivalent to around 1.1 kilotons of TNT) had been stored in a warehouse without proper safety measures for the previous six years, after having been confiscated by the Lebanese authorities from the abandoned ship MV Rhosus. The explosion was preceded by a fire in the same warehouse, but as of October 2020, the exact cause of the detonation is still under investigation. (Wikipedia)
Work Flow:
- Research on the explosion and approximate radius of where the most severe damage occurred (one of the maps I found, here)
- Obtain layers for country and administrative boundaries and building use in Beirut
- Selecting buildings within 2km radius:
- I used the buffer tool.
- First, I needed to change the coordinate system of the building layer from a geographic coordinate system to a projected coordinate system to use the buffer tool to measure linear distance. I converted it from WGS84 to UTM zone 36N (EPSG:32636) for Lebanon.
- Then, I simply created a 2 km and 8 km buffer. 8 km buffer was just to sort of check that my 2 km buffer was accurate. It’s such a large area that it wouldn’t have mattered to show 8 km on my map for the zoom level I wanted. I also measured the distance on Google Maps to see if it matched my buffer just to make sure nothing was distorted in my map.
- Finally, I used Select by Location to select all the features in the building use layer that intersects and is within the 2 km buffer
- Created new layers from the 2 km selection and also the > 2km buildings to easily change the symbology in separate layers
- Edit symbology and added explosion location by adding a point feature
- Converted everything back into WGS84 so that I could add a base map
- Added an extent indicator to show explosion location at a zoomed out level
