Check out our project website!
Description
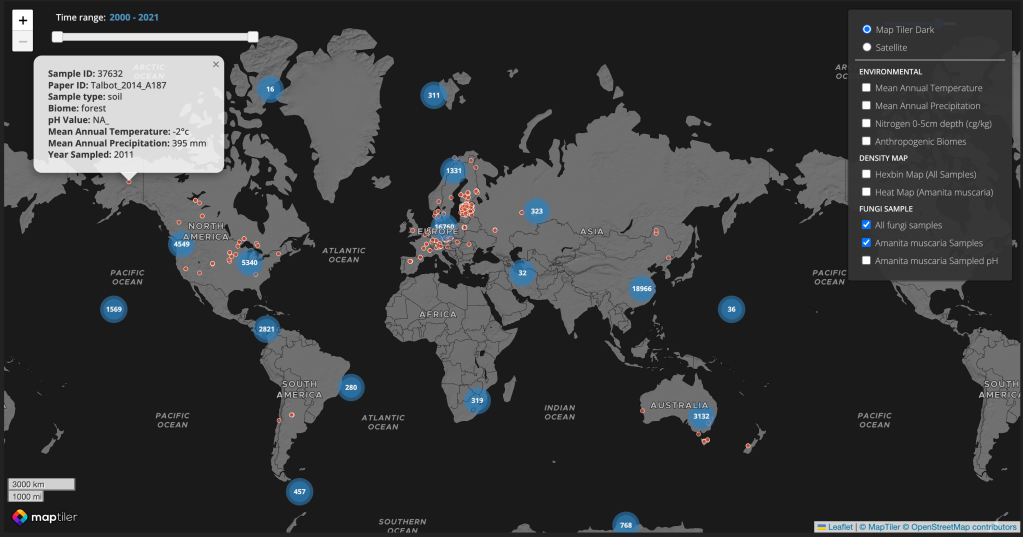
Using the Global Fungi fungi NGS dataset, we aim to explore thematic mapping and visualization techniques that help scientists better analyze and visualize this data through a web map or dashboard. The current web interface for Global Fungi has map-related functions only for a geo-search and displaying samples as points on the map. There are no further cartographic techniques applied to the web maps to help visualize the datasets. The current visualizations provided are mainly pie charts and tables.

Outcome
We managed to create a usable web map that has multiple visualization techniques for the point data and also combine other environmental data layers important for fungi. The map is also supplemented with visualizations of general statistics of the database created with D3.


My role
- Development of the web page and responsiveness
- Development of web map using Leaflet JS (map component, layers, sidebar)
- Base map creation using MapTiler
- Creation of fungi database using PostGIS
- Publishing of database and WMS layers on Geoserver
- Generation of statistical charts using D3.js
**Hexbin map layers will not be displayed on the link above because it is locally hosted on Geoserver. You can see these map layers in the screen shot below:

Tools:
- HTML, CSS, JavaScript
- D3.js
- Leaflet.js
- qGIS
- PostgreSQL
- Geoserver WMS
- Google Earth Engine
Timeline: 1 month, June 2023
